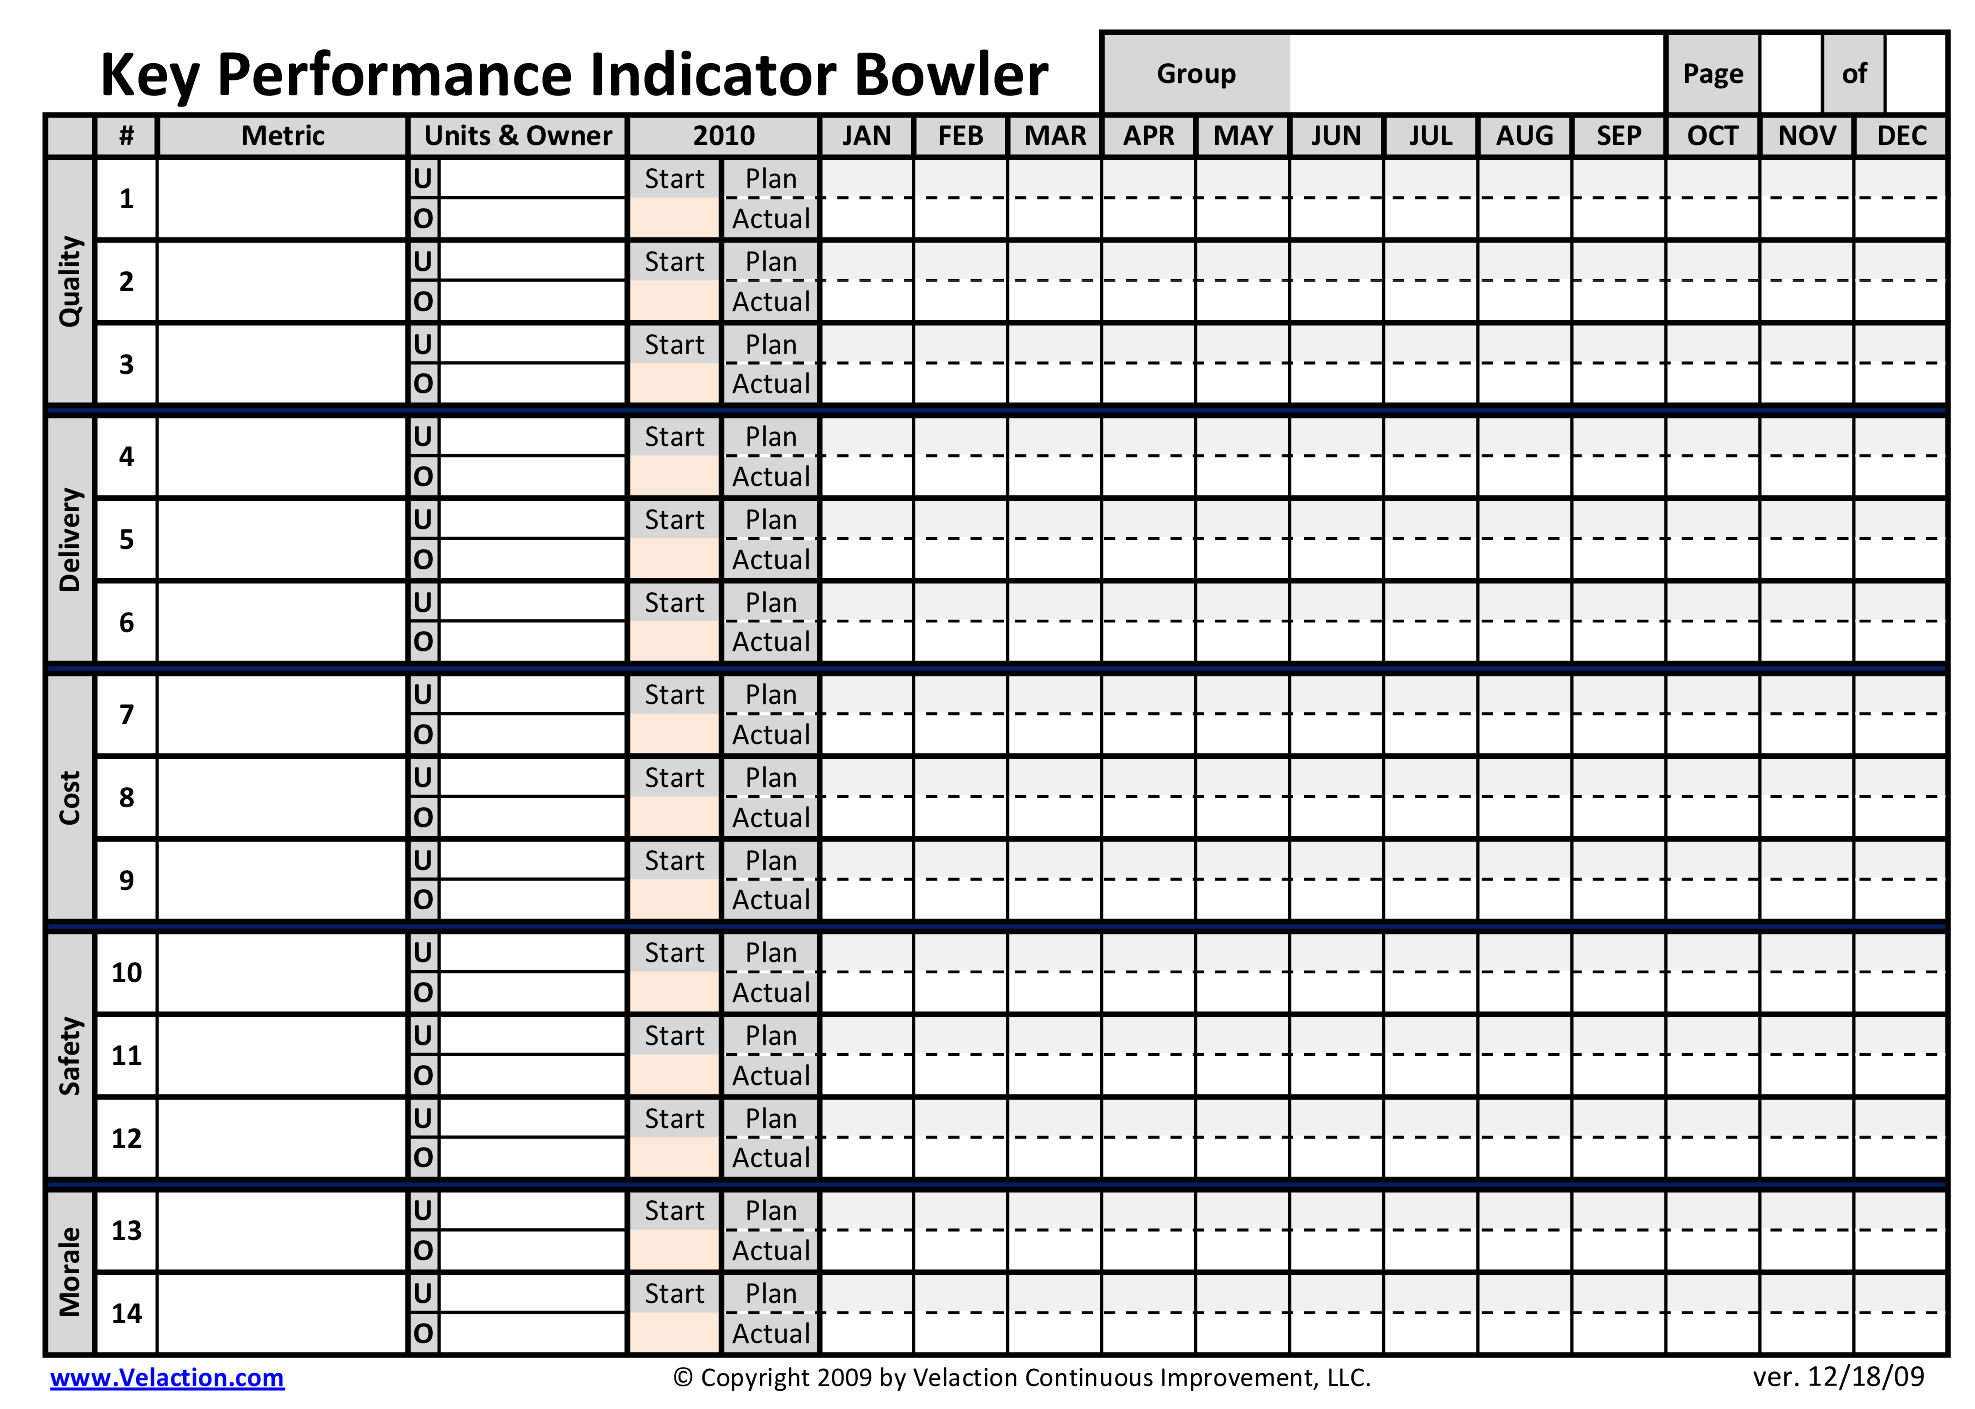
Bowling Chart
“Bowling chart” is the nickname given to the tracking sheets used to monitor either KPIs or policy deployment objectives. Its name comes from the similarity to a bowling scorecard. You may also hear the term “bowler” used to describe these forms.
The form compares the targets (plan) to actual performance on a monthly basis.

Get this KPI Bowler (Free Download Available)
 Watch Our Managing With Metrics Video
![]()
We offer two types of bowling charts.


0 Comments