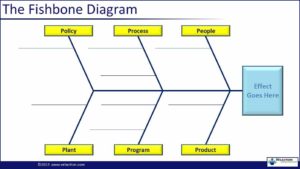
6 P’s
The 6 P’s is a mnemonic tool similar to the 6 M’s. Both are used to categorize causes on an Ishikawa (cause & effect) diagram. The 6 M’s were traditionally used for fishbone diagrams on the shop floor or other production environments.
The 6 P’s originated when more and more companies began migrating Lean to the office. The 6 P’s are:
- Policy
- Process
- People
- Plant
- Program
- Product
 Learn About the 3 P’s in Our Cause and Effect Diagram Video

Let’s look at the 6 P’s in more detail.
- Policy: Policy affects office environments much more than they affect the shop floor. The degree of flexibility in responses to customers, for example, is often guided by policy-driven rules.
- Process: Processes may be formal or informal. Informal processes are sometimes called the “hidden factory”, or the “hidden office.”
- People: The makeup, size, and skills of a team all have an impact on the effect you are looking at in your fishbone diagram. Be careful not to assign process, policy, or program causes to people. Use this category as a last resort.
- Plant: The physical layout of the building and the proximity to other locations fall into this category.
- Program: Program, in this usage, refers to software programs. It may include corporate wide systems, or individual software packages installed on a computer.
- Product: This final “P” refers to the information/service product that is being processed. It includes the raw information coming in, on through the final output that is delivered to the customer.

When using these categories, be careful of wasting time deciding which category a cause should fit into. The point of this segmentation is to spur thought. As long as the idea is on the table, it isn’t worth slowing down brainstorming to get the category “right.”


0 Comments