Extrapolation
There’s and old joke.
There are two types of people in the world. Those that know what extrapolation is, and those…
If you know what extrapolation is, you get the joke.
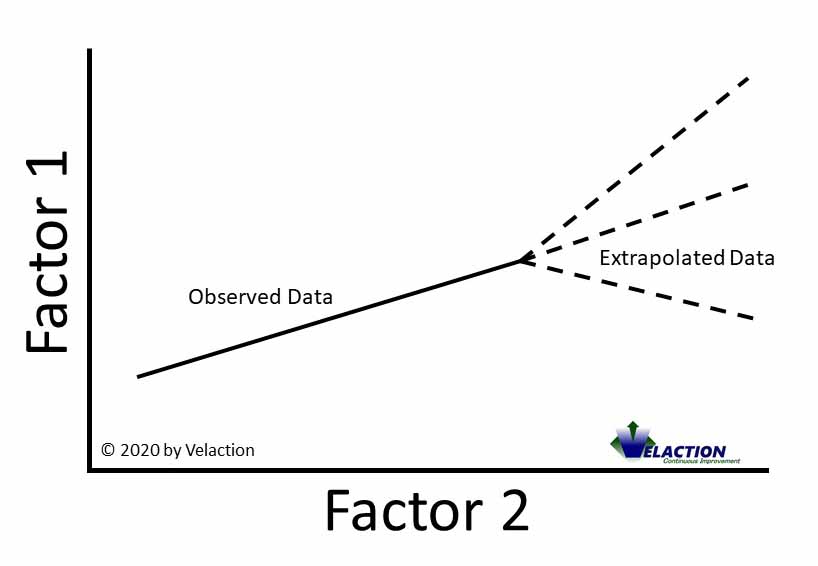
Extrapolation is the process of making an estimate of what data will look like based on the current trend. It is ‘filling in the blanks’ of data at the end of a series of observed values. This contrasts with interpolation, which is when you fill in data blanks within a series.


Extrapolation has value, but also carries risk. When making decisions, you won’t always have a complete set of data. Sometimes you have to make educated guesses. When the risk is low and the benefit is high, extrapolation can be extremely useful.
When there is a lot riding on the outcome, though, and a wrong decision would create a substantial problem, extrapolation is not a good idea. It relies on the basic assumption that the defining characteristics of the data you have will carry over into the area where you do not have data.
Imagine that you own a theme park and are projecting concession sales based on attendance. You might see that concession sales rise as attendance goes up, and that the correlation is relatively linear and predictable with the range that you have observed.
Now, you are offering a great promotion in order to increase attendance by 10%, with the assumption that you will see that correlation continue with the same relationship. There’s a good chance, though, that at some point you will reach the capacity of your food stands. Even if there is demand, there would be no way to meet it. The curve will flatten out at that point, and the increase in attendance will no longer raise concession sales.
In this example, if the cost of the promotion factored in all those additional concession sales, you might end up losing money on the event. That is the risk of extrapolation. Sometimes the data does things you don’t expect.
Mathematical Extrapolation
Many data sets can be expressed with mathematical expressions. If you remember from high school, a basic line on a chart follows the expression y=mx+b. If you know the slope of the line (m) which is the ratio between changes in x (the horizontal value) and y (the vertical value), and you know “b” which is where the line crosses the y axis, then you can extrapolate for any value based on the other value by plugging the value into the equation.
While this is the most basic of equations, mathematicians will have large set of equations at their disposal to define the shape of a variety of relationships. There are also regression techniques which are used to extend out data sets.
This math all relies on knowing the relationships and factoring in assumptions, which may or may not end up being correct.
Extrapolation and Continuous Improvement
We use a lot of gut-check extrapolation in continuous improvement, often without even realizing it. For example, if we see X% fewer stockouts from putting Y% of our parts on kanban, we might estimate how much of a reduction (Y+10)% might have. That projection is extrapolation.
When extrapolating for your continuous improvement projects, my recommendation is to try to list out all the assumptions that have to hold true for the extrapolation to be accurate. The more assumptions you make, the less likely the extrapolation will be correct.
One area of concern is in projecting out aggregate gains from continuous improvement efforts, specifically when doing your budgeting and policy deployment/strategy planning. Early projects tend to have a lot of low hanging fruit and can generate substantial improvement and cost savings. Later projects can be mixed. Your company will gain experience in both breadth (more people will be trained on it) and in depth. The level of both corporate knowledge and individual knowledge will both rise a lot. The two opposing trends working at the same time tend to…
Extended Content for this Section is available at academy.Velaction.com

