Tribal Knowledge

Tribal knowledge is the unwritten collective wisdom of an organization. It refers to the tradition of tribes handing information down from generation to generation in the time before the written word was developed. In the same fashion, when information is not document properly, it must be passed from employee to Read more…
Histogram

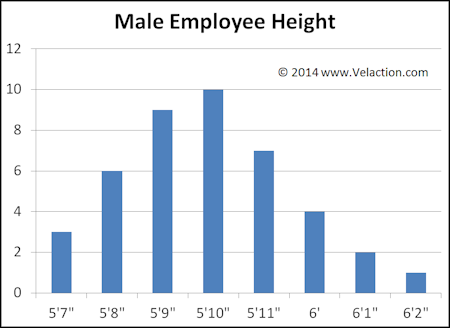
A histogram is a specialized form of bar chart that shows the distribution of the data it is representing. Each bar represents a uniform range of data values, with the height of the bar showing the number of occurrences that fall into that range. Because a histogram shows a distribution, Read more…

Capability

Capability simply means that a person or machine has the ability to perform a required task. It is a binary measure. That simply means that it is physically possible in the current state to do something, or it is not. Capability should not be confused with yield or effectiveness (how Read more…

Common Cause Variation

Common cause variation is the predictable, repetitive, systemic portion of variation. Contrast this with special cause variation, caused by unusual occurrences. Common cause variation, in a nutshell, is the consistent random (or random appearing) fluctuation built into a process. It is also frequently referred to as noise. While common cause Read more…

6 P’s

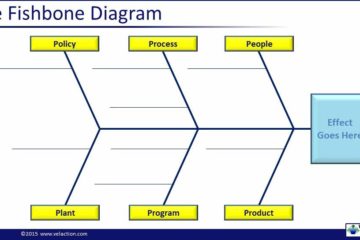
The 6 P’s is a mnemonic tool similar to the 6 M’s. Both are used to categorize causes on an Ishikawa (cause & effect) diagram. The 6 M’s were traditionally used for fishbone diagrams on the shop floor or other production environments. The 6 P’s originated when more and more Read more…

6 M’s

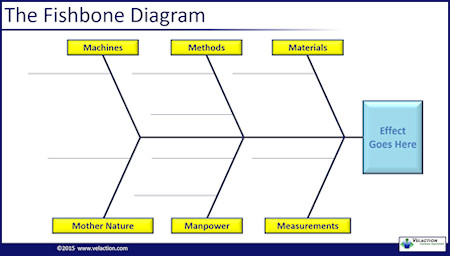
The 6 M’s are a mnemonic tool used primarily during the creation of a cause & effect diagram. The 6 M’s are: Machines Methods Materials Mother Nature Manpower (People Power) Measurements Watch the 6 M’s Video Let’s look at the 6 M’s in more detail. Machines: Tools and equipment used Read more…