Hansei

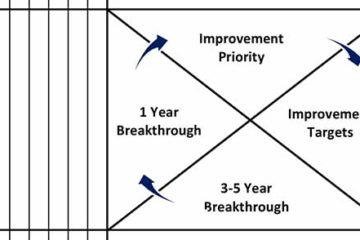
Hansei is a Japanese term that loosely translates to self-reflection. In practice, though, it is much more than that. Hansei requires several things. A person must recognize that there is a problem in personal performance. Hansei is not a run-of-the-mill assessment tool. It looks at personal failings rather than system Read more…
6S

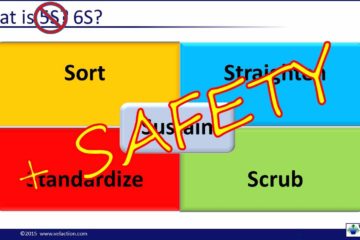
6S is a mnemonic device used to recall the steps to improve workplace organization and effectiveness. It is essentially 5S with safety specifically added. The six “S” terms are: Sort Straighten Scrub Standardize Sustain Safety In truth, safety should always be considered when making any changes, observations, or assessments about Read more…

The Lean Machine (Guest Post from Tony Ferraro)

Notes from Jeff:  I’d like to thank my guest author, Tony Ferraro for his contribution to the Gotta Go Lean Blog.

Lean manufacturing is something many companies strive for but only some attain. Many businesses implement different strategies in order to make processes faster, cheaper, and more efficient. Let’s face it, in this day and age we are either meeting or exceeding the ever-changing customer expectations, or we are simply treading water just trying to stay afloat. The art of continuous improvement has a lot to do with how successful a business is…

CEDAC

CEDAC is an acronym that stands for cause and effect diagram with the addition of cards. It is a very specific way of building a fishbone diagram in which team members contribute ideas written on 3 x 5 cards or Post-it notes. CEDAC is a problem-solving tool that relies on Read more…

Bowling Chart

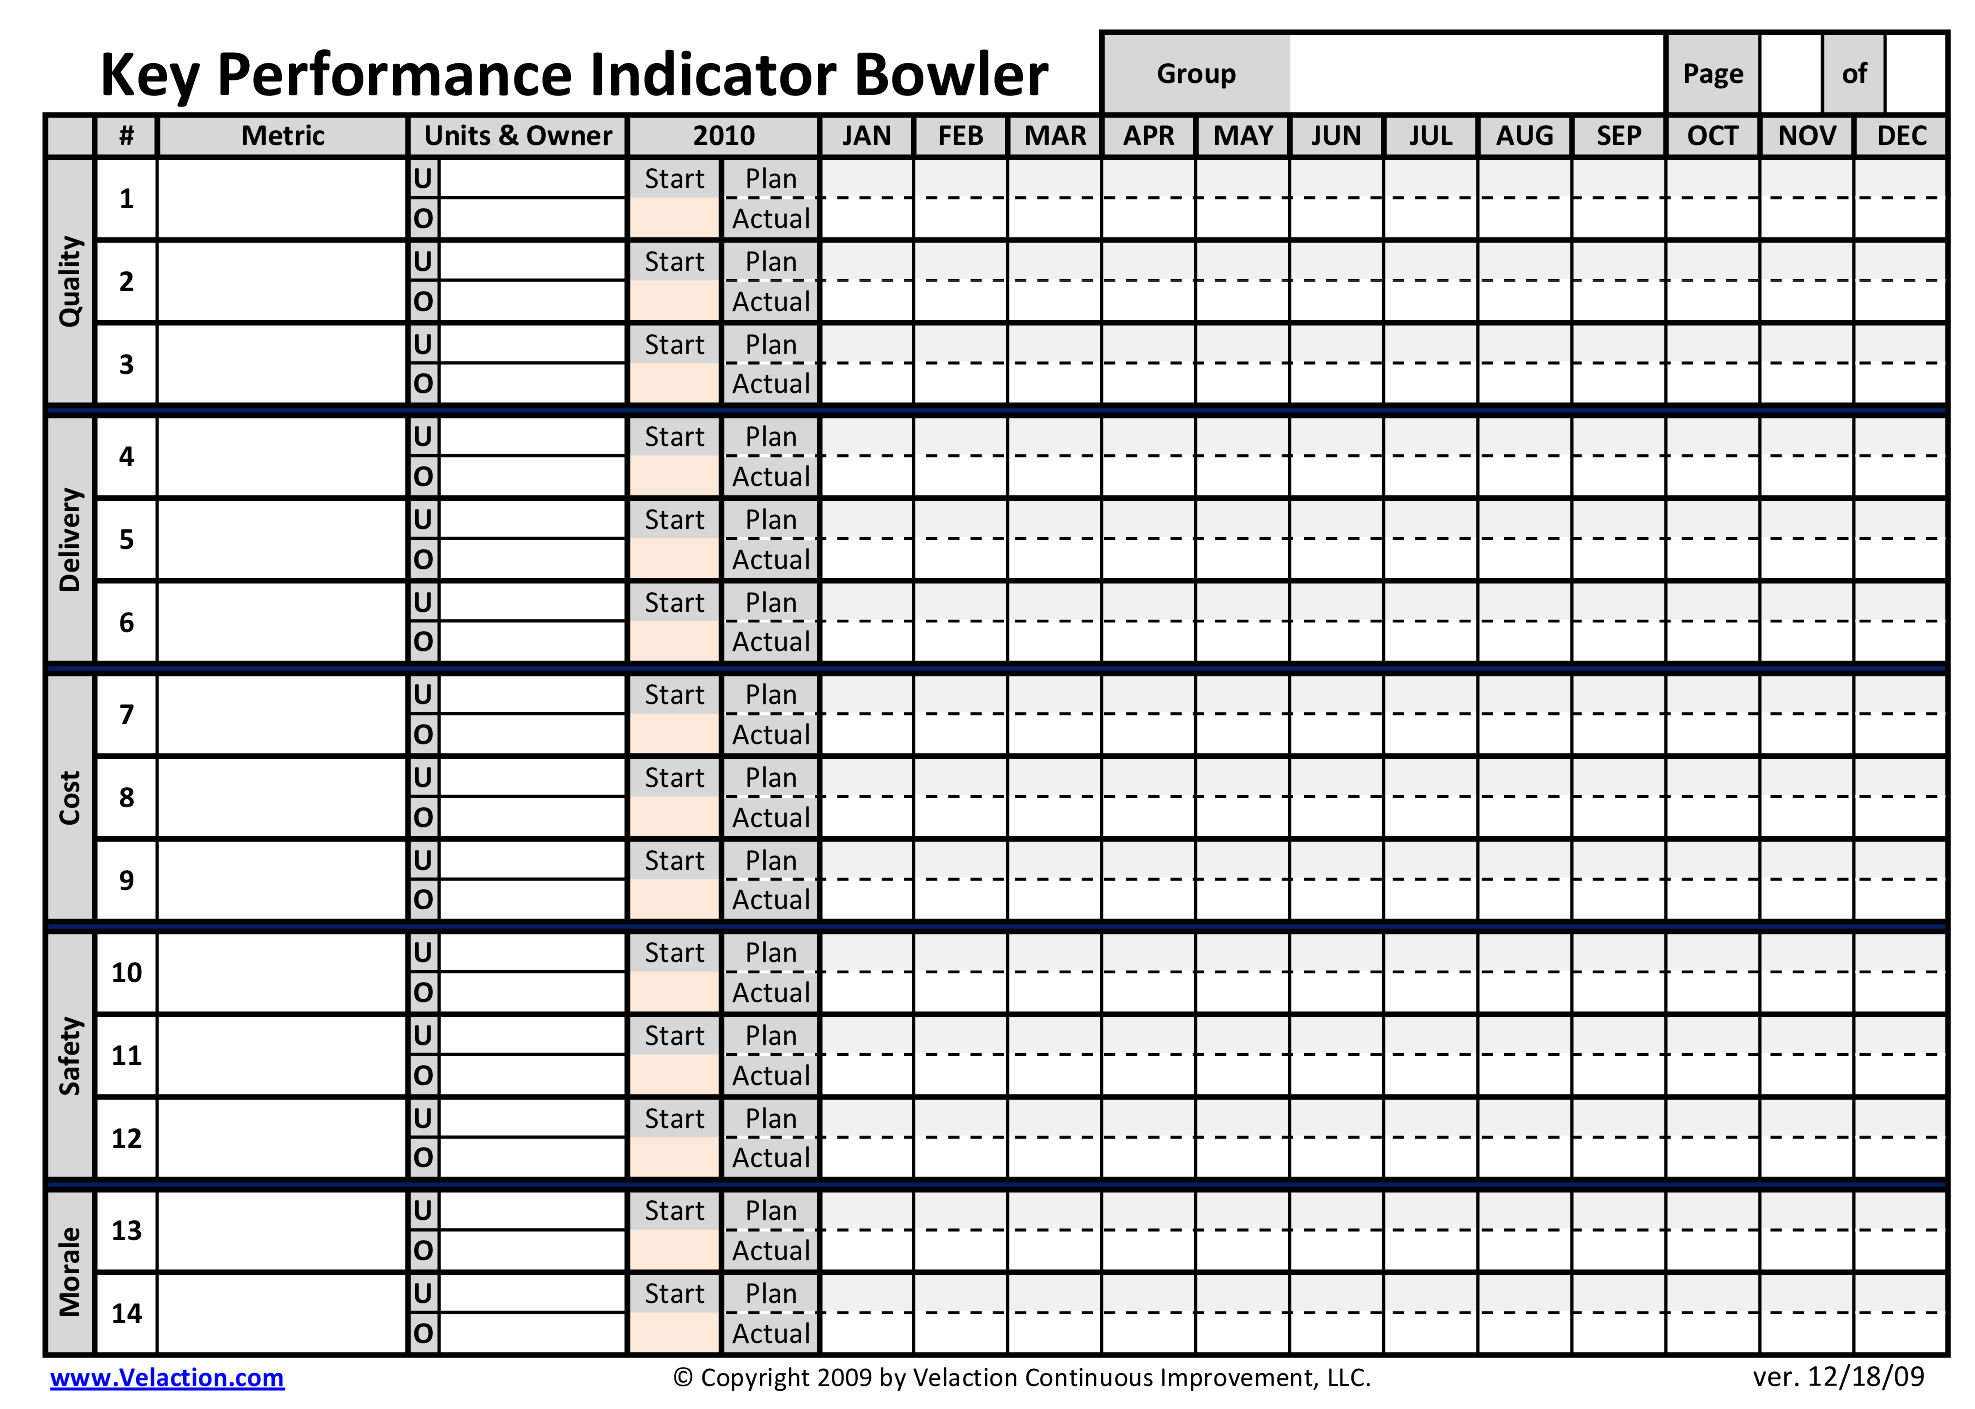
“Bowling chart” is the nickname given to the tracking sheets used to monitor either KPIs or policy deployment objectives. Its name comes from the similarity to a bowling scorecard. You may also hear the term “bowler” used to describe these forms. The form compares the targets (plan) to actual performance Read more…

Annual Objectives

In the generic definition, annual objectives are simply the company’s goals for a calendar year. In most cases these goals should target a degree of improvement. In a Lean organization, however, there’s a much more specific definition for annual objectives. It is a key component of policy deployment. Strategies are Read more…

Run Chart

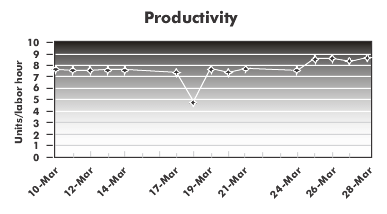
A run chart is a tool used to show a change in a value over a period of time. It depicts a time-ordered series of data plots with time on the X-axis (horizontal) and the value of the data on the Y-axis (vertical). Run charts are particularly powerful because they Read more…

Think Like Your Competitor to Beat Your Competitor

While continuous improvement is a great and wonderful thing, it has one glaring weakness. You have to be right when you define what improvement actually is. If you missed the mark, you’ll just get more effective at doing the wrong thing.

One trick that you can use to make sure that your definition of improvement is correct is to look at yourself through the eyes of your competitor. Imagine that you are a marketing manager for the business you most frequently go head-to-head against. What weaknesses would you try to exploit? Which of your own strengths would you try to emphasize? What are your advantages from the customer perspective?

Weekly Update (May 13, 2013)

Notable News

  • I am dabbling with the idea of doing a brief weekly podcast, possibly with our frequent partner Tim McMahon, of ALeanJourney.com. We are still trying to work out the scheduling details and what the show would actually look like, so this is your chance to have some input. One of the ideas is a quick rundown of all the content we post combined some current events, but I am open to suggestions. The number one objective is to give you something that can help you keep Lean efforts front and center in your operation. Send your ideas and suggestions to info@velaction.com. Thanks.
  • I’ve also shuffled the posting calendar up a bit. I wanted to move the updates to Monday and cover the previous week. That means a cascade of changes for the rest of the calendar.