Value

Value, simply put, is something that a customer is willing to trade for. The trade is most commonly done with cash, meaning that a customer is willing to pay for it. Not all things that are valued are paid for, though. Consider the numerous free downloads on websites (including our Read more…

Process Map

A process map is a visual representation of how work flows through an operation. In practical Lean applications, it is often used synonymously with the term process flow chart. The truth though, is that “process map” is a generic term. A process flowchart is just one specific type of process Read more…

Hansei

Hansei is a Japanese term that loosely translates to self-reflection. In practice, though, it is much more than that. Hansei requires several things. A person must recognize that there is a problem in personal performance. Hansei is not a run-of-the-mill assessment tool. It looks at personal failings rather than system Read more…

6S

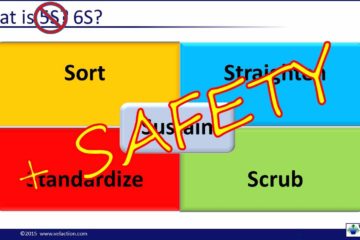
6S is a mnemonic device used to recall the steps to improve workplace organization and effectiveness. It is essentially 5S with safety specifically added. The six “S” terms are: Sort Straighten Scrub Standardize Sustain Safety In truth, safety should always be considered when making any changes, observations, or assessments about Read more…

CEDAC

CEDAC is an acronym that stands for cause and effect diagram with the addition of cards. It is a very specific way of building a fishbone diagram in which team members contribute ideas written on 3 x 5 cards or Post-it notes. CEDAC is a problem-solving tool that relies on Read more…

Bowling Chart

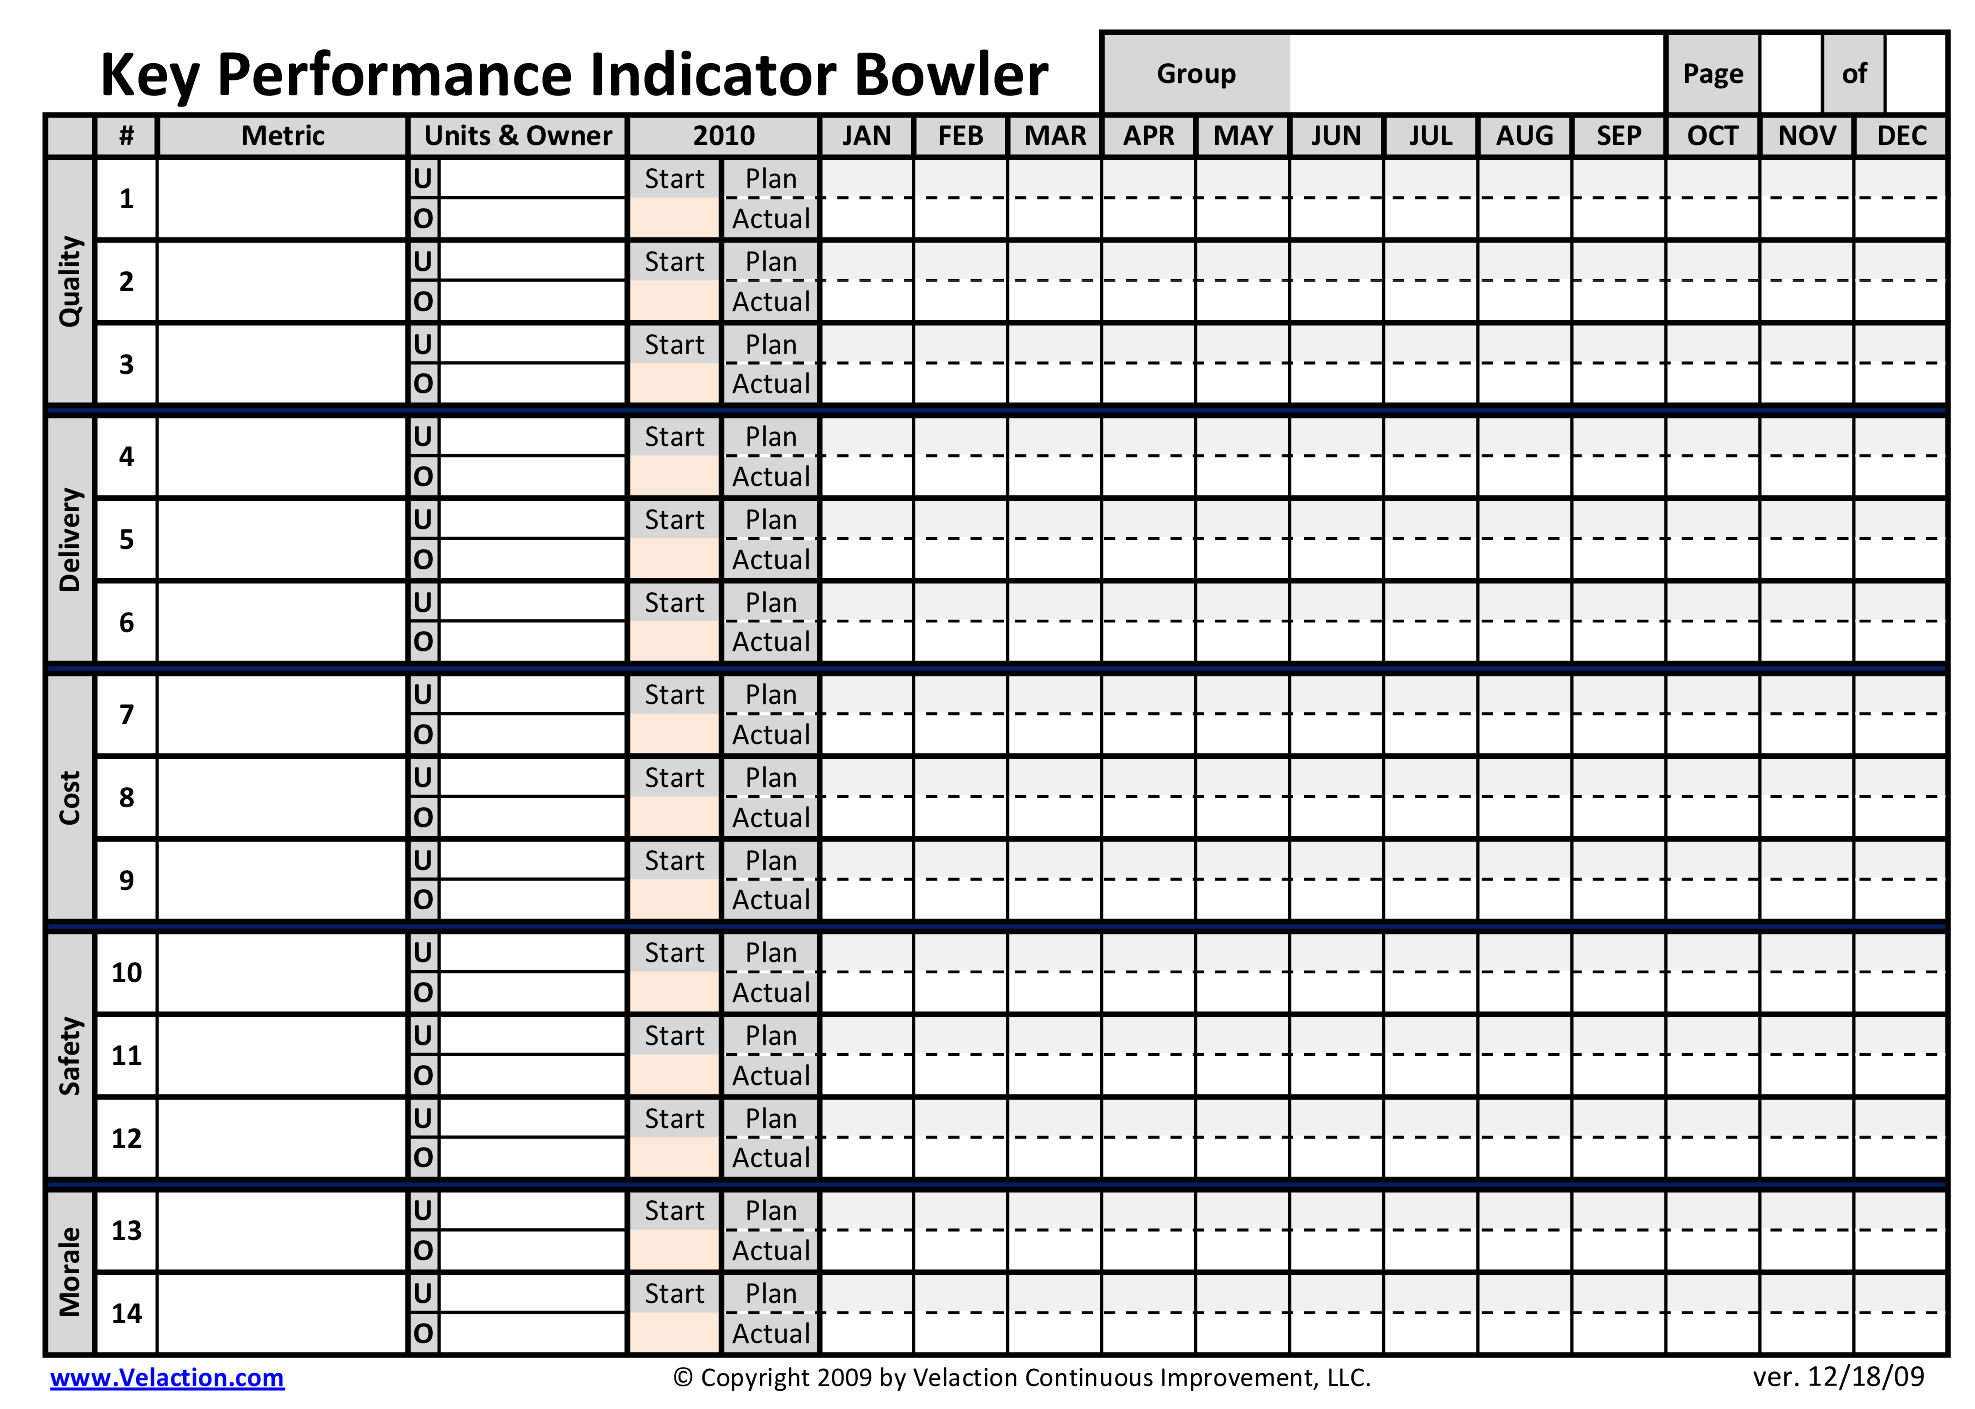
“Bowling chart” is the nickname given to the tracking sheets used to monitor either KPIs or policy deployment objectives. Its name comes from the similarity to a bowling scorecard. You may also hear the term “bowler” used to describe these forms. The form compares the targets (plan) to actual performance Read more…

Annual Objectives

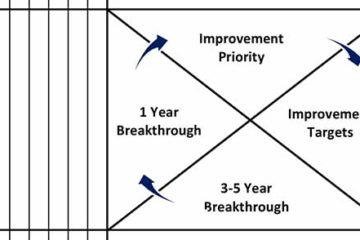
In the generic definition, annual objectives are simply the company’s goals for a calendar year. In most cases these goals should target a degree of improvement. In a Lean organization, however, there’s a much more specific definition for annual objectives. It is a key component of policy deployment. Strategies are Read more…

Run Chart

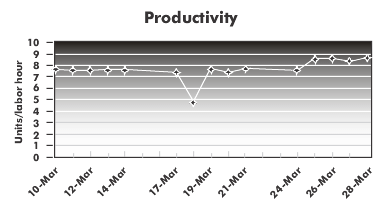
A run chart is a tool used to show a change in a value over a period of time. It depicts a time-ordered series of data plots with time on the X-axis (horizontal) and the value of the data on the Y-axis (vertical). Run charts are particularly powerful because they Read more…