Gotta Go Lean Blog

Tribal Knowledge

Tribal knowledge is the unwritten collective wisdom of an organization. It refers to the tradition of tribes handing information down from generation to generation in the time before the written word was developed. In the same fashion, when information is not document properly, it must be passed from employee to employee. There are many obvious shortcomings to relying on tribal knowledge. Information may be passed incorrectly. This is similar to the telephone game that elementary Read more…
Histogram

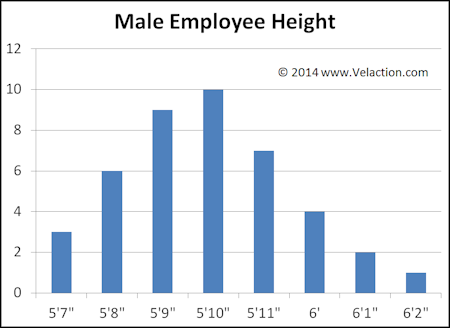
A histogram is a specialized form of bar chart that shows the distribution of the data it is representing. Each bar represents a uniform range of data values, with the height of the bar showing the number of occurrences that fall into that range. Because a histogram shows a distribution, it is best suited for data with continuous numerical values that fall within a specified range. In the example above, for example, a person could Read more…

Capability

Capability simply means that a person or machine has the ability to perform a required task. It is a binary measure. That simply means that it is physically possible in the current state to do something, or it is not. Capability should not be confused with yield or effectiveness (how good the resources is at doing the process), or with capacity (how often the resource can complete a task.) For a machine, capability means that Read more…

Common Cause Variation

Common cause variation is the predictable, repetitive, systemic portion of variation. Contrast this with special cause variation, caused by unusual occurrences. Common cause variation, in a nutshell, is the consistent random (or random appearing) fluctuation built into a process. It is also frequently referred to as noise. While common cause and special cause can be layman distinctions, they are also mathematically calculable. Control charts are the best example of this. Control charts look at the Read more…

7 Basic Tools of Quality / 7 QC Tools

The “7 Basic Tools of Quality“ (or 7 QC Tools) is a set of relatively simple data analysis tools used to support continuous improvement efforts, specifically as they relate to quality. These tools are fairly straightforward in that they don’t require sophisticated statistics to use though control charts do border on being too complex for the typical user to develop. The 7 Basic Tools of Quality are: Cause and Effect Diagram (or Ishikawa Diagram or Read more…

6 P’s

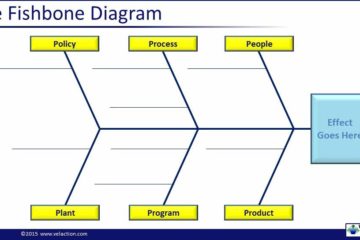
The 6 P’s is a mnemonic tool similar to the 6 M’s. Both are used to categorize causes on an Ishikawa (cause & effect) diagram. The 6 M’s were traditionally used for fishbone diagrams on the shop floor or other production environments. The 6 P’s originated when more and more companies began migrating Lean to the office. The 6 P’s are: Policy Process People Plant Program Product Learn About the 3 P’s in Our Cause Read more…

6 M’s

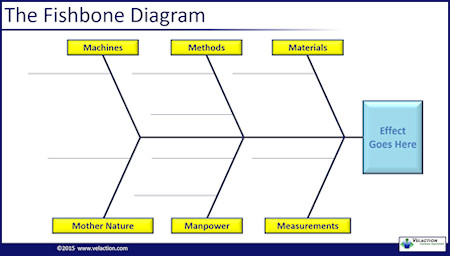
The 6 M’s are a mnemonic tool used primarily during the creation of a cause & effect diagram. The 6 M’s are: Machines Methods Materials Mother Nature Manpower (People Power) Measurements Watch the 6 M’s Video Let’s look at the 6 M’s in more detail. Machines: Tools and equipment used to complete production tasks. Facility systems also fall into this category. Methods: Production and support processes. Materials: Raw materials, components, and supplies used for production. Read more…

Delphi Method

The Delphi method of predicting outcomes has been around for a long while but is not widely used in continuous improvement. It is the process of posing questions to many experts and using a summary of their results to further a discussion to predict a future outcome. One such panel was formed by a television network to estimate how fast HDTV would be adopted. The panel accurately predicted delays, helping the network to postpone significant Read more…

Buffer (Production)

A production buffer is a type of inventory allocated specifically as a hedge against variation. The root cause of the unpredictability may be due to the normal variation of a process, or any of a variety of types of special cause variation. The latter causes include things like supplier unreliability, machine breakdowns, and high defect rates. The size of the buffer is related to the frequency and duration of the problems, and to the ease Read more…

Automated Guided Vehicle (AGV)

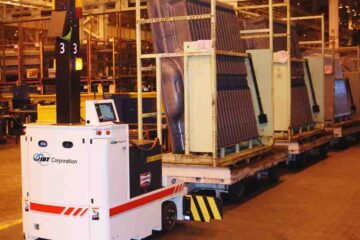
Automated guided vehicles (sometimes called Automatic Guided Vehicles) are driverless vehicles that primarily perform transportation functions. In most cases, they support materials groups in distribution of raw materials and in movement of finished goods. These vehicles may either operate similar to a pallet jack, and carry the load, or as a tow-truck, and pull the load. They are guided by a variety of means, including a buried wire with RF transmissions, magnetic tape, reflectors mounted Read more…

Drift (Process)

Most processes change over time. A car will age, and as it undergoes normal wear and tear, gas mileage will worsen. It won’t be an overnight change, but it will trend downward. This is drift. Processes, with no visible changes, often slowly perform differently. A fixture may loosen up over time, making it take longer to fasten the product in place. A measuring device may be subjected to a series of small bumps over time Read more…

Right-Sized Machine

Production processes require assets to run them. You generally have choices. You can use a big machine that costs a lot of money but has tremendous functionality and flexibility. These machines, because of their cost, end up being used in several processes or for several products to defray the cost. This tends to disrupt flow. The alternative is to buy or build a smaller machine that may have fewer functions. This machine is dedicated to Read more…