Run Chart

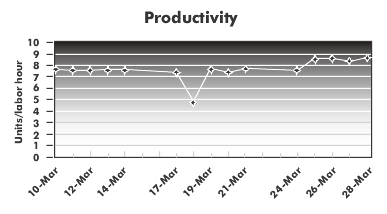
A run chart is a tool used to show a change in a value over a period of time. It depicts a time-ordered series of data plots with time on the X-axis (horizontal) and the value of the data on the Y-axis (vertical). Run charts are particularly powerful because they Read more…

Flow Chart

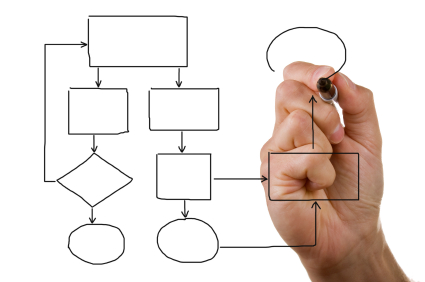
A flowchart is a visual representation of the progression of an entity (product, person, information, etc.) through a process. A flowchart is a visual representation of the progression of an entity (product, person, information, etc.) through a process. Flow charts have two main uses. Process flow charts are used for Read more…

Daily Management

Daily management is a structured approach to running an operation. In a nutshell, daily management is the constant application of the PDCA cycle to a production process. Daily management consists of: Planning: Daily management requires an understanding of what demand will be, and of the capabilities of the organization. It Read more…

Kaizen Event

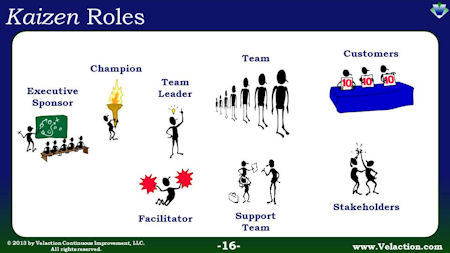
A kaizen event is a discrete continuous improvement project with a defined start and end point, usually done in a single week. A typical kaizen event consists of a day of training, a day of process walking and analyzing the information gathered, followed by two days of improvement activity. The Read more…

A3 Thinking and PDCA

A3 Thinking

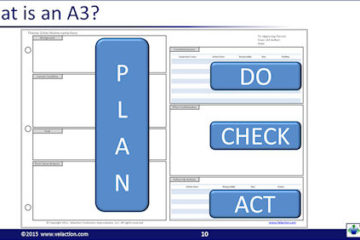
What is A3 Thinking? A3 thinking is a philosophical approach to problem solving that centers on a well-communicated team approach to using the PDCA cycle. The tool used to apply this way of thinking is known as the A3 report. Download our Free A3 Report Template A3 Thinking Background Whether Read more…

Line Stop

A line stop is exactly what it sounds like. A team member presses a button that prevents an assembly line from advancing. This typically happens for one of two main reasons. Someone discovered a quality issue. Someone was not finished with their work. Other reasons might include maintenance problems, misplaced Read more…

Takt Time Calculation

Takt Time

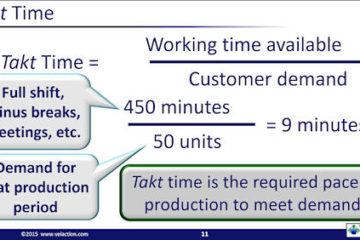
Takt time is the required pace of production to meet customer demand. It is calculated by dividing the working time available, generally for that shift, by the customer demand during that time period. Despite its apparent simplicity, it is one of the most misunderstood terms in continuous improvement. It is Read more…