Histogram

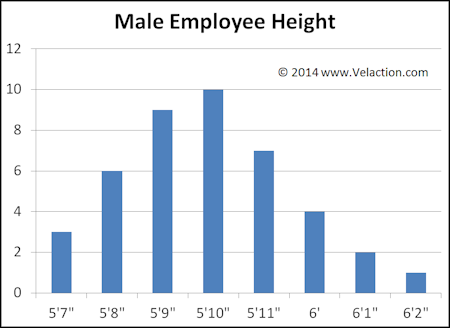
A histogram is a specialized form of bar chart that shows the distribution of the data it is representing. Each bar represents a uniform range of data values, with the height of the bar showing the number of occurrences that fall into that range. Because a histogram shows a distribution, Read more…

Common Cause Variation

Common cause variation is the predictable, repetitive, systemic portion of variation. Contrast this with special cause variation, caused by unusual occurrences. Common cause variation, in a nutshell, is the consistent random (or random appearing) fluctuation built into a process. It is also frequently referred to as noise. While common cause Read more…

6 P’s

The 6 P’s is a mnemonic tool similar to the 6 M’s. Both are used to categorize causes on an Ishikawa (cause & effect) diagram. The 6 M’s were traditionally used for fishbone diagrams on the shop floor or other production environments. The 6 P’s originated when more and more Read more…

6 M’s

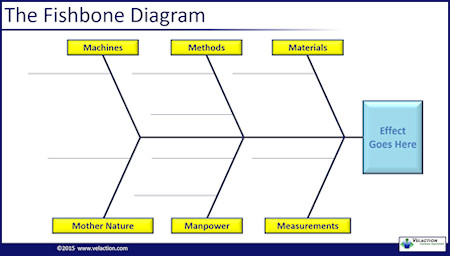
The 6 M’s are a mnemonic tool used primarily during the creation of a cause & effect diagram. The 6 M’s are: Machines Methods Materials Mother Nature Manpower (People Power) Measurements Watch the 6 M’s Video Let’s look at the 6 M’s in more detail. Machines: Tools and equipment used Read more…