Measure the Things You Can Control

As I’ve mentioned in many previous articles, sports provide an outstanding backdrop to teach Lean lessons. This aspect of athletics was reinforced in a recent article in ESPN magazine. It takes a detailed look at the statistics behind one pitcher’s performance.

This player had an outstanding year in 2012. By one measure, he was responsible for adding 5.3 wins to his team. This year though, using the same metric, he is responsible for one additional loss. On the surface, this looks like a fairly significant drop in performance. The problem though, is…
Solutions

Solutions in a Lean environment tend to be temporary. The rationale behind the statement lies within the term “continuous improvement”. Any new process you develop, by definition, will eventually change. “Solution” implies that a problem is solved once and for all. The two terms don’t play nice together. I don’t Read more…

Nominal Conditions

A key requirement in a Lean operation is to make abnormal conditions stand out. Obviously, to recognize abnormal, you must also understand what normal is. Nominal conditions define your standard and let you see that you are operating within acceptable limits. Note that the term “nominal conditions” is not one Read more…

Why Offense and Defense Scoring Rankings are Horrible Metrics for the NFL

I am an avid fan of the NFL. I love looking over the stats almost as much as watching games. The numbers tell you a lot about the flow of the game.

The stats, though, are can be misleading. Take scoring offense and scoring defense, for example. Let’s say that a team gives up few points. This can happen because the defense is stout or because the offense is great and controls the ball. With a few less possessions in a game, you’d expect to see fewer points.

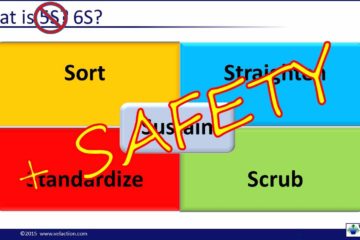
6S

6S is a mnemonic device used to recall the steps to improve workplace organization and effectiveness. It is essentially 5S with safety specifically added. The six “S” terms are: Sort Straighten Scrub Standardize Sustain Safety In truth, safety should always be considered when making any changes, observations, or assessments about Read more…

CEDAC

CEDAC is an acronym that stands for cause and effect diagram with the addition of cards. It is a very specific way of building a fishbone diagram in which team members contribute ideas written on 3 x 5 cards or Post-it notes. CEDAC is a problem-solving tool that relies on Read more…

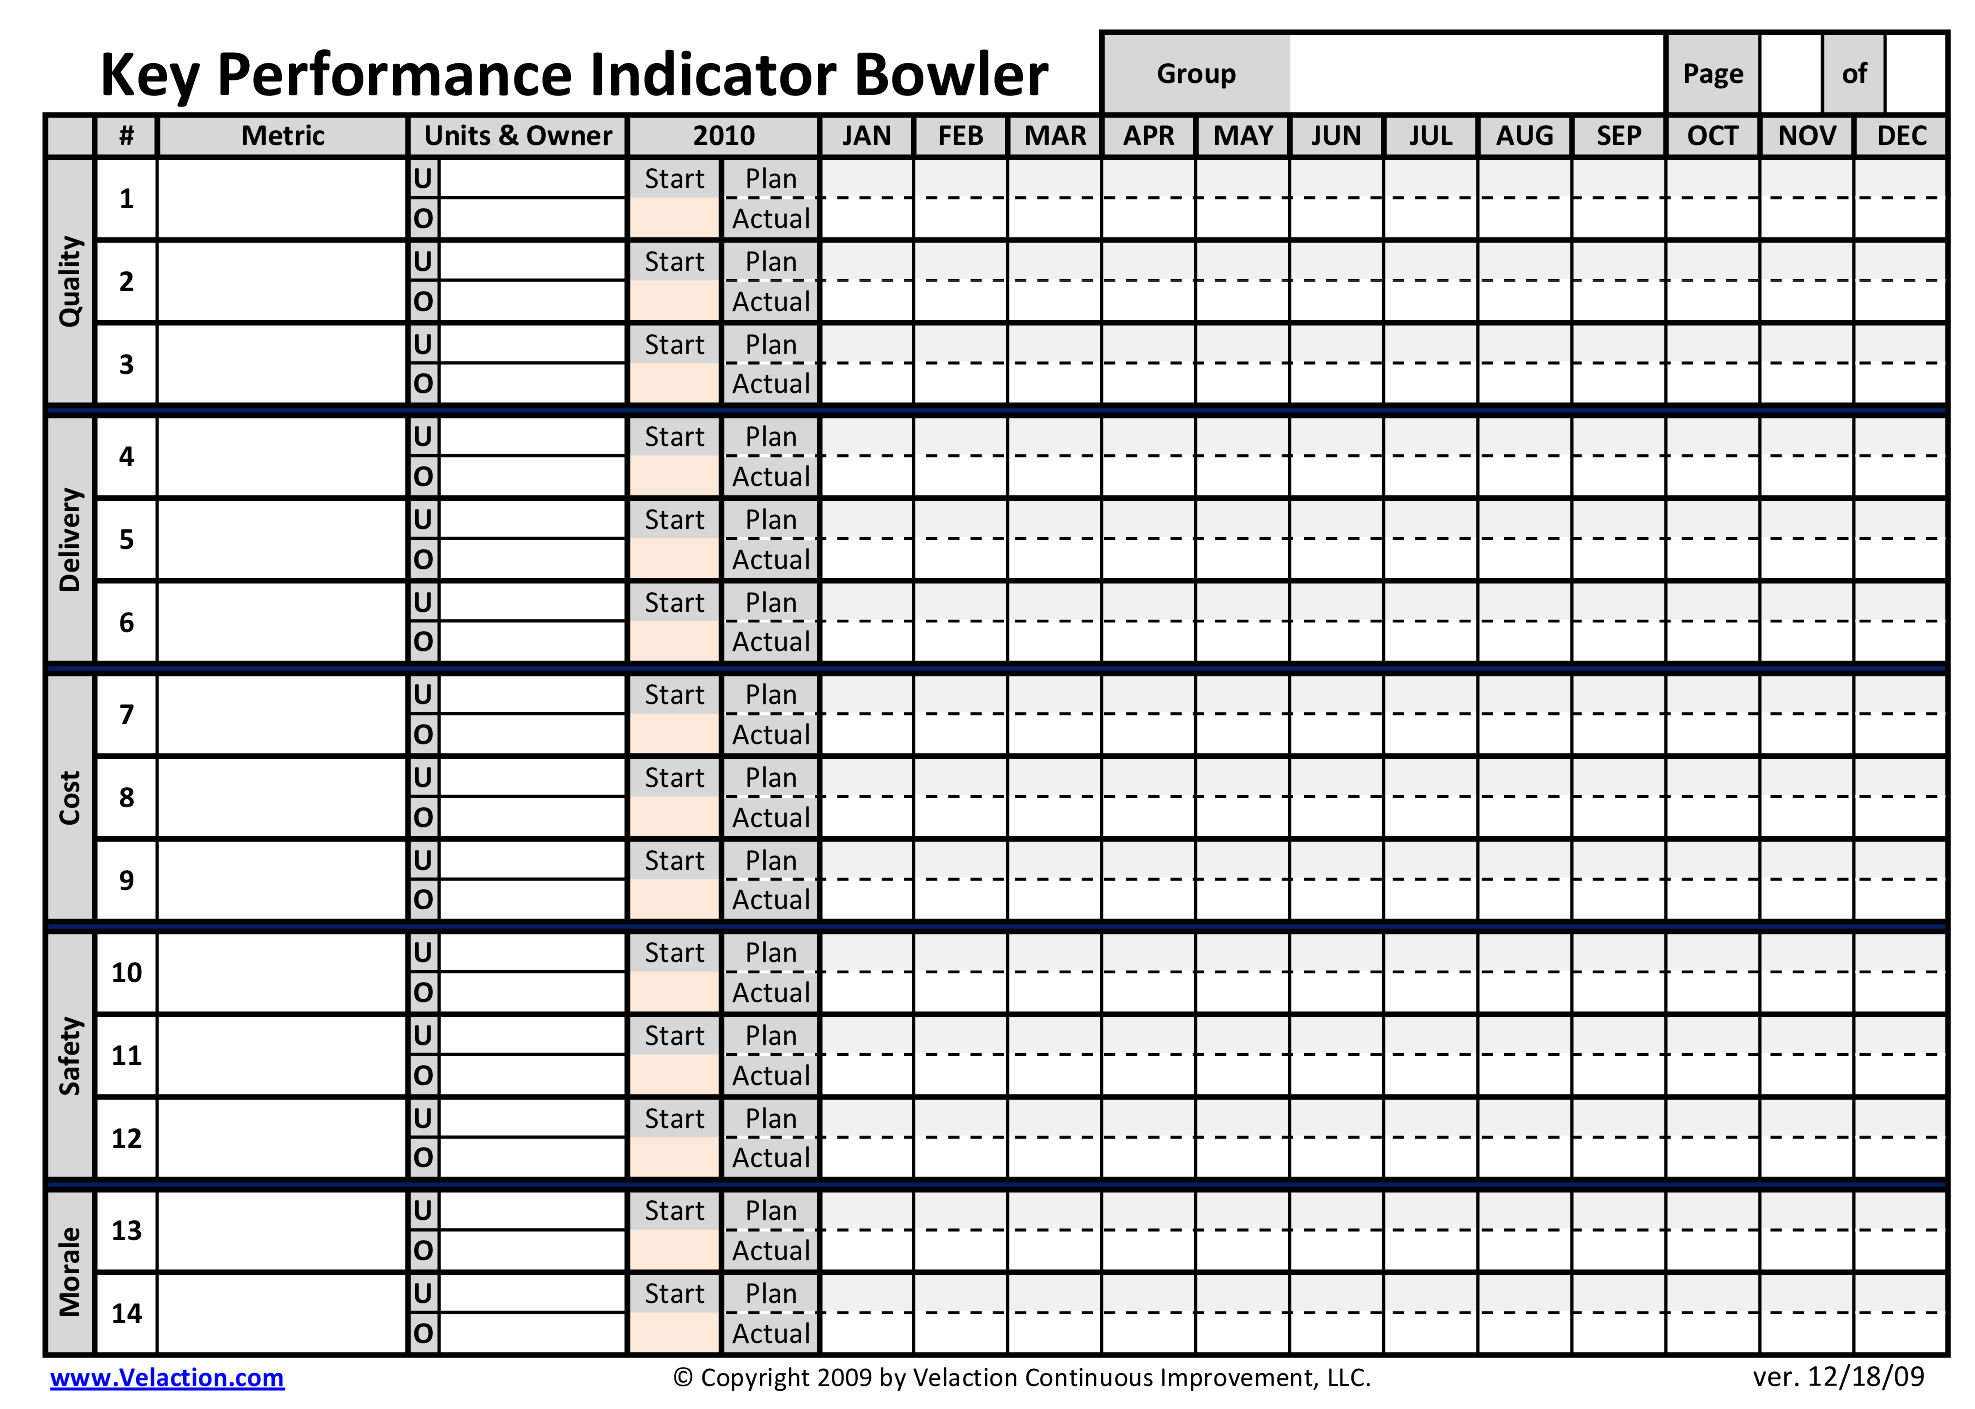
Bowling Chart

“Bowling chart” is the nickname given to the tracking sheets used to monitor either KPIs or policy deployment objectives. Its name comes from the similarity to a bowling scorecard. You may also hear the term “bowler” used to describe these forms. The form compares the targets (plan) to actual performance Read more…

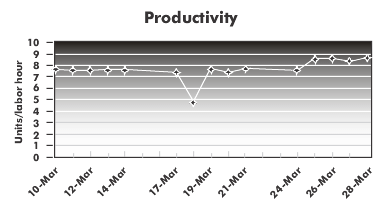
Run Chart

A run chart is a tool used to show a change in a value over a period of time. It depicts a time-ordered series of data plots with time on the X-axis (horizontal) and the value of the data on the Y-axis (vertical). Run charts are particularly powerful because they Read more…